Automation
Corporate Sales Reporting — From Manual Excel to Automated Pipeline
Varies by person and cycle→Identical every runreport consistency
The entire corporate sales reporting process depended on a single analyst manually pulling CSVs, pasting them into Excel templates, and formatting the results before emailing them out. Because this process was entirely manual, it was inherently inconsistent; output looked different depending on who ran it and how much time they had. Furthermore, the reports merely displayed raw numbers, failing to highlight crucial trends, velocity, or movement that business leaders actually needed to make decisions. The fragility of this system was exposed whenever the primary analyst was on leave, causing reports to be delayed by days or sent with glaring data errors. This human bottleneck created a pervasive lack of trust in the critical numbers driving the business.
// system visuals
See It In Action
LIVE_SYSTEM_PREVIEW
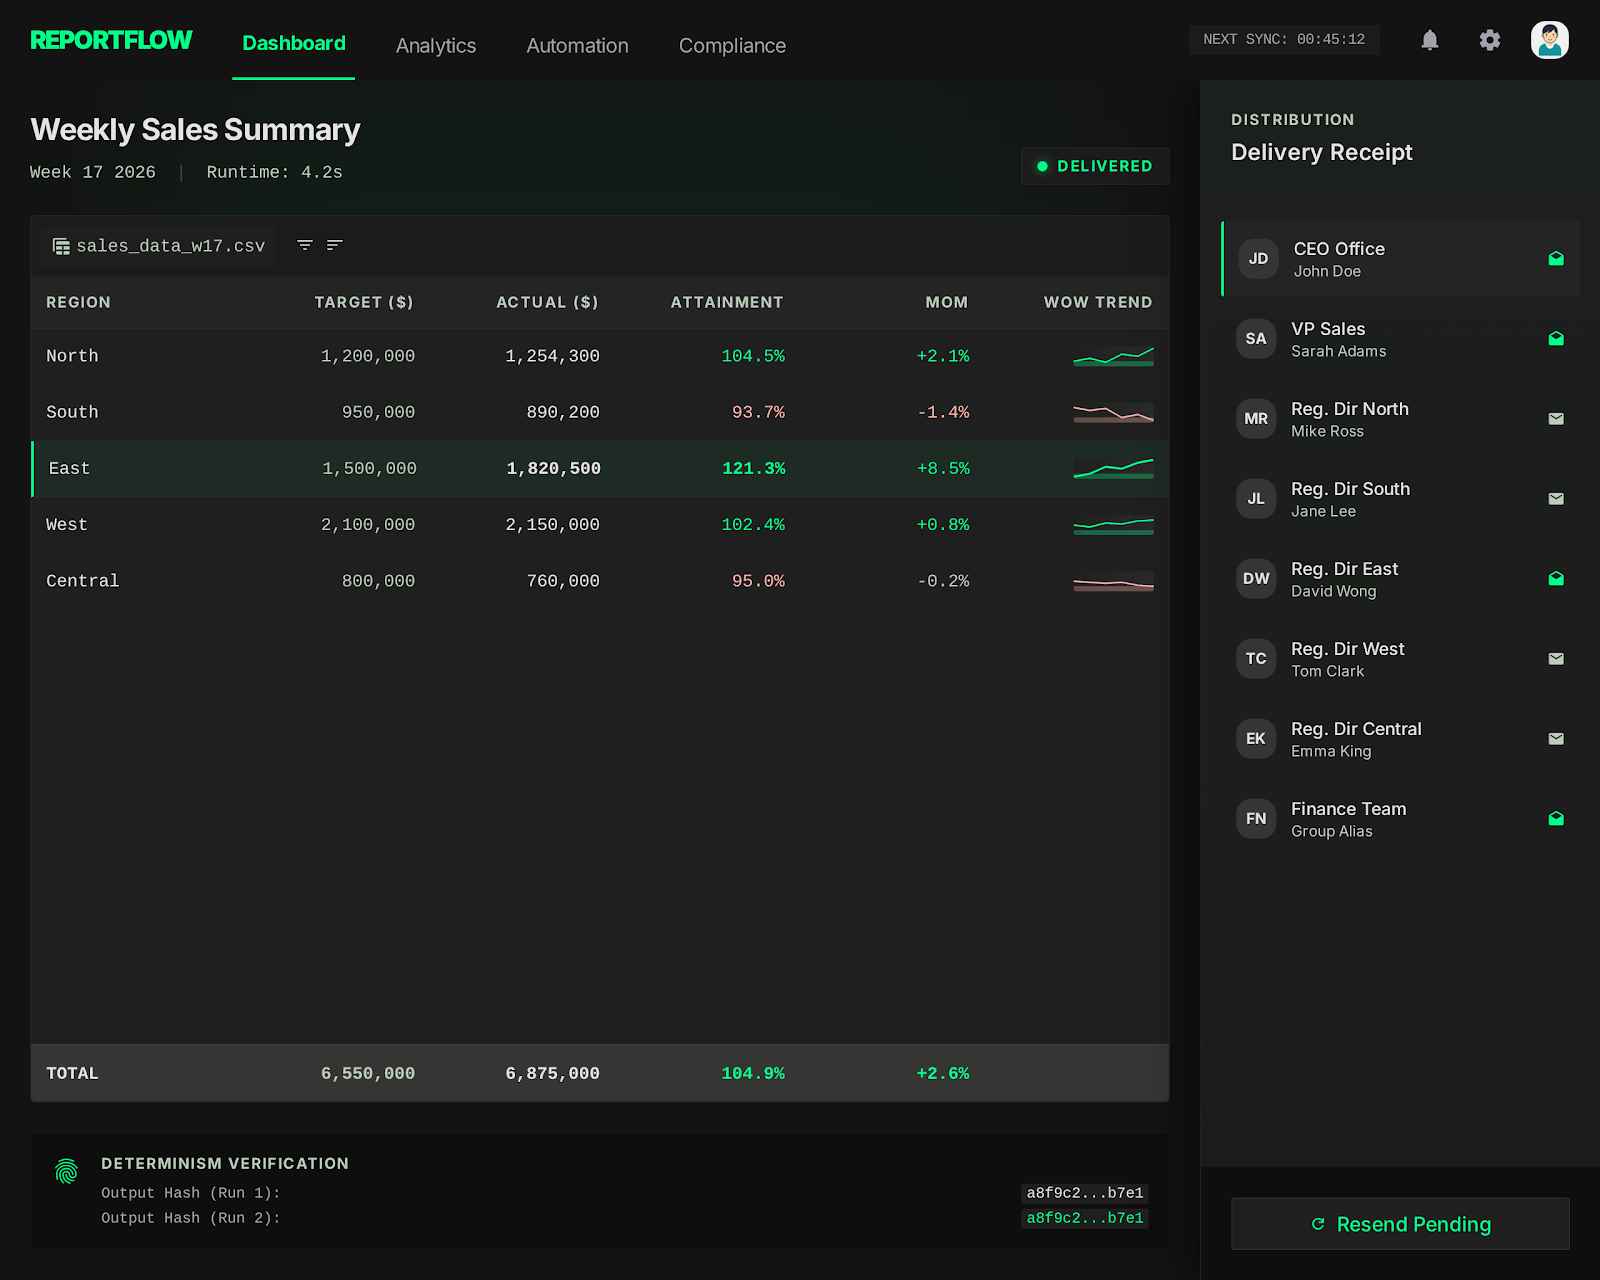
01/02
← → NAVIGATE_SYSTEM
// the problem
What Was Broken
- Manual formatting meant that the output looked subtly different every single reporting cycle, depending on who was tasked with building it. Standardized the output entirely using deterministic Python formatting, guaranteeing visual and structural consistency.
- The reports only showed raw, isolated numbers without context, providing no indication of trends, momentum, or actionable anomalies. Engineered the pipeline to automatically calculate and highlight week-over-week and month-over-month deltas.
- Delivery was entirely dependent on one person remembering to run the queries, format the data, and send the email before end-of-day. Removed this dependency completely by scheduling the pipeline to execute and deliver autonomously.
- Data quality issues—like missing values or corrupted input—went completely undetected until an executive questioned a number during a meeting. Implemented a strict ingestion validation layer that catches and flags dirty data before transformation begins.
// required fix
- The pipeline had to eliminate the variance introduced by manual formatting and human error. The goal was to establish absolute repeatability as the core design principle, guaranteeing identical output every run.
- Stakeholders needed actionable insights, not just a data dump. The task required structuring the report to immediately surface trends, deviations, and comparative metrics that drive business decisions.
- The dependency on human memory and availability for delivery had to be eradicated. The objective was to build a reliable scheduling and delivery mechanism that handled distribution autonomously.
- Corrupted inputs were breaking trust in the final output. The task demanded a rigorous data validation step that intercepts and isolates quality issues before they can pollute the final report.
// solution
How It Was Built
A robust Python pipeline was constructed utilizing Pandas for complex, deterministic data transformations and OpenPyXL for generating heavily formatted Excel outputs based on locked templates. A critical validation layer was introduced at the very beginning of the pipeline to explicitly check for schema violations, missing data, and out-of-range anomalies. The logic was restructured to automatically calculate momentum metrics, shifting the focus of the report from static totals to dynamic trends. Finally, the entire process was wrapped in a scheduling daemon that handles execution, error alerting, and automated email delivery via SMTP.
Data Validation at Ingestion
- The pipeline previously failed silently when the source data contained missing values or structural changes, causing massive confusion downstream.
Repeatability-First Pipeline
- The core requirement was achieving byte-identical repeatability, which is impossible when humans manually format Excel cells.
- 📄 pipeline/report.py
Automated Delivery
- To remove the human bottleneck entirely, the finalized pipeline was deployed onto a reliable internal server and scheduled via cron.
Data Validation at Ingestion
The pipeline previously failed silently when the source data contained missing values or structural changes, causing massive confusion downstream. To prevent this, a strict data validation layer was engineered as the very first step in the pipeline using Pandas. Before any transformation occurs, the script checks the input schema against expected column names, flags null values in critical fields, and verifies that numerical metrics fall within expected ranges. If an anomaly is detected, the pipeline halts the main report generation and instead generates an internal validation report detailing exactly what data is malformed. This ensures that clean data goes in, or a clear explanation of the failure is surfaced, completely eliminating the risk of silently distributing corrupted reports.
Repeatability-First Pipeline
The core requirement was achieving byte-identical repeatability, which is impossible when humans manually format Excel cells. The solution leveraged Pandas for all mathematical transformations, ensuring that aggregations and calculations were entirely deterministic. For the output generation, OpenPyXL was utilized to inject this transformed data into pre-built, locked Excel templates. This approach ensured that complex formatting, corporate branding, and specific cell styling remained flawless without requiring the Python script to handle low-level styling logic. The pipeline automatically calculates trend indicators, applying conditional formatting logic within Python to highlight positive or negative momentum visually. No manual formatting steps remain anywhere in the execution chain.
pipeline/report.py
python
def generate_report(data: pd.DataFrame, period: str) -> bytes:
    validated = validate_schema(data)
    enriched = add_trend_columns(validated)  # WoW, MoM delta
    wb = load_template('sales_template.xlsx')
    write_data(wb, enriched)
    write_trend_highlights(wb, enriched)
return save_to_bytes(wb)Automated Delivery
To remove the human bottleneck entirely, the finalized pipeline was deployed onto a reliable internal server and scheduled via cron. The script was expanded to handle its own distribution, utilizing an internal SMTP relay to email the generated Excel files to a predefined distribution list. Crucially, the system was designed with robust error handling; if the pipeline fails due to a database timeout or validation error, it does not silently skip the cycle. Instead, it immediately fires an alert to the engineering team with the stack trace. This guarantees that stakeholders either receive their report on time, or engineering is already working on the fix before anyone has to ask where the report is.
// results
What Changed
The reporting process evolved from a fragile, manual chore into a highly reliable, automated pipeline that executes flawlessly on schedule. The shift from presenting raw numbers to highlighting actionable trends dramatically changed how business leaders interacted with the data, moving it from the archives to the center of strategy meetings. By structurally eliminating human error and enforcing strict consistency, trust in the critical business metrics was fully restored.
Report consistency
Varies by person and cycle
→
0
Fully repeatable
Delivery dependency
Manual (person-dependent)
→
0
Zero manual steps
Report utility
Filed away
→
0
Decision-ready
"The report went from something people archived to something people brought to meetings. Consistency and trend visibility made the difference."